What Is a Perceptual Map?
Learn what perceptual maps are, see a real car brand example, and get a step-by-step method to collect consumer data, plot competitors and find gaps.

Brand, strategy and insights leaders face the same positioning questions in every category: whether to move upmarket, which benefit to claim, where a new line should sit against the brands already on shelf. Each answer depends on how buyers see the brand next to its competitors, and that view rarely matches the feature list or the positioning deck. This guide explains how perceptual maps capture that view, how to build one from consumer data, and how to read it before acting on what it seems to show.
What is a perceptual map?
A perceptual map is a chart that shows how consumers see a brand next to its competitors. A team picks two attributes that drive purchase in the category, such as price and quality, asks consumers to rate each brand on them, and plots every brand where its ratings land. Brands that consumers see as alike end up close together. Brands they see as different end up far apart.
The purpose is positioning. One chart shows which brands consumers lump together, which attributes a brand owns, and where the grid is crowded or open. Marketing texts treat the map as a way to choose which benefits a brand should compete on, and as a planning sheet for repositioning: draw where the brand sits today, then mark where it should move.
Perceptual map vs positioning map
The two terms are often used interchangeably. Where a distinction is drawn, a perceptual map plots how consumers see the brands, and a positioning map plots where the company intends each brand to sit.
A perceptual map example
Car brands are the standard teaching case, because price and sportiness split the category in ways most consumers recognize. A study by Chaturvedi and Carroll, published in the Journal of Classification in 2006, places 16 cars on two dimensions that the researchers interpreted as price and a single axis running from luxury to sportiness.
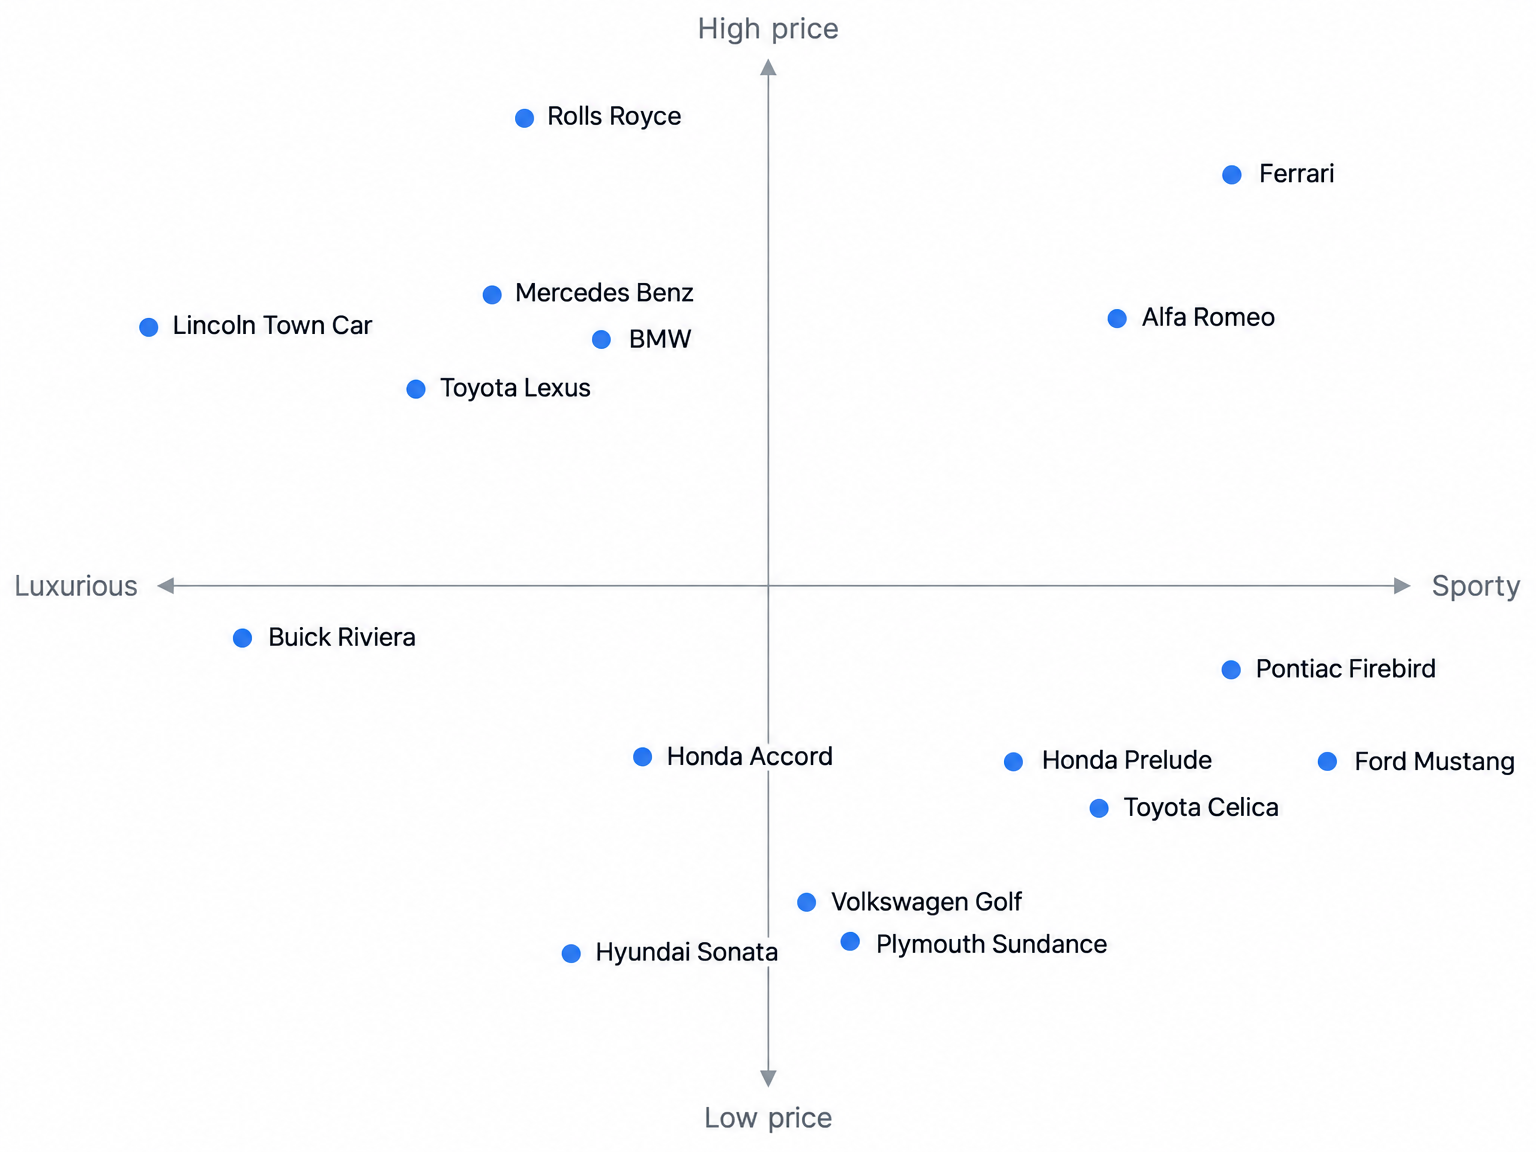
Reading the published solution gives four annotations:
- Price axis: Rolls-Royce and Ferrari sit at the top as super-luxury cars, followed by Mercedes Benz, BMW, Alfa Romeo, Lincoln Town Car and Toyota Lexus, with the Hyundai Sonata, Plymouth Sundance and Volkswagen Golf at the low-cost end.
- Luxury-to-sportiness axis: Ferrari, Ford Mustang, Pontiac Firebird and Alfa Romeo sit at the sporty end, and the Lincoln Town Car and Buick Riviera sit at the big, luxurious sedan end.
- Economy cluster: The Honda Accord, Hyundai Sonata, Plymouth Sundance and Volkswagen Golf sit near the middle of the sportiness axis, read by consumers as neither sporty nor luxurious.
- Empty space: The source does not identify an open position, which is the right restraint, because an empty region tells a team where to ask about demand rather than proving demand exists.
How to build a perceptual map
Building the map takes four steps, and the choice of attributes in the first shapes everything after it.
Step 1: Choose and name the axes
The axes should be attributes consumers use when they decide what to buy, sometimes called determinant attributes. A team that guesses at them gets a tidy chart about things buyers ignore. Three rules keep the axes honest:
- Start from consumer language. Interviews or Kelly triads (show three brands, ask which one differs and why) produce bipolar labels in consumers’ own words, which then become the rating scales.
- Avoid correlated pairs. If consumers treat price and quality as the same signal, every brand falls along a diagonal and the second axis adds nothing, so combine the two or replace one, and drop any attribute on which every brand scores the same.
- Label both ends. “Budget to premium” or “conservative to sporty” tells the reader what each direction means and makes the middle of the axis readable.
Step 2: Collect consumer perception data
The data has to come from consumers. Bain & Company’s 2005 survey of 362 firms is two decades old, but the gap it measured is the reason this step exists: 80% of companies believed they delivered a superior experience, and their customers said 8% did.
Four collection methods feed perceptual maps:
- Rating scales: Respondents rate each brand on each attribute, often on semantic differential scales with bipolar pairs such as expensive to inexpensive on five or seven points, and large grids can be split so each person rates a subset of brands and attributes.
- Similarity judgments: Respondents rate how alike pairs of brands are, which needs no researcher-chosen attribute list, though the number of pairs climbs quickly as brands are added.
- Sorting tasks: Respondents group brand cards into as many piles as they like, and the count of how often two brands share a pile becomes a similarity score.
- Focus groups and interviews: These generate the attribute list before the quantitative work, and AI-moderated interviews let hundreds of consumers explain their brand perceptions.
Step 3: Score and plot competitor positions
Once ratings are in, plotting is arithmetic. Average each brand’s score on each attribute across respondents in the target segment, then plot each brand at its two averages.
An ideal point adds preference to the map. Respondents rate their ideal product on the same scales, the team plots the average, and brands closer to it are the more preferred ones. That works for a segment with similar tastes. When segments differ, plot each segment’s ideal separately, because a single average can land where no one wants to be.
Step 4: Sense-check the finished map
Compare the map with sales and share data before acting on it. A mismatch does not invalidate either measure, but it can identify questions the current attributes do not answer.
Advanced methods: MDS, PCA and factor analysis
Two-attribute maps get hard to defend once a study rates brands on 15 or 20 attributes. Statistical methods compress those ratings into two dimensions, and the input data helps determine which one fits:
- Multidimensional scaling (MDS): MDS takes similarity judgments between pairs of brands and arranges the brands so map distances match how alike consumers said they were, after which the analyst names the dimensions by judgment; similarity scaling generally needs at least seven or eight brands for a two- or three-dimensional map.
- Principal component analysis (PCA): PCA takes the table of average ratings per brand and finds two combined dimensions that capture the largest differences in the ratings, drawing attributes as arrows on the map so a reader can see which way each one increases.
- Factor analysis: Factor analysis also works on ratings, grouping correlated attributes into a few underlying themes, such as value or style, which suits studies where many attributes measure the same idea.
- Correspondence analysis: This method works on counts, such as how often respondents tick an attribute for each brand, and yes/no grids are quick for respondents to complete.
How to interpret a perceptual map
Reading the map starts with the axis labels, because a position only means something relative to them. Each quadrant is a combination, such as premium and sporty or budget and conservative. Clusters show brands consumers treat as substitutes, and a brand inside a tight cluster competes head-on with its neighbors.
What distance between brands does and does not mean
Closeness means consumers perceive two brands as similar on the plotted attributes. It says nothing about market share, quality or preference, unless the team has added an ideal point. A small brand can sit right beside the category leader, which is why some maps size each bubble by share. Two brands close together on these two axes can also differ sharply on an attribute the map leaves out.
Finding market gaps on a perceptual map
An empty region on the grid identifies a question for research, not proof of demand. A market opportunity may also not be a brand opportunity: if consumers do not see a brand as qualified to offer something, the gap does not carry over to that brand.
Teams validate a gap in sequence:
- Overlay ideal points by segment, since a gap with no ideal nearby is usually empty for a reason.
- Concept-test a product in the gap with the target segment, and use a volumetric test for a rough sales estimate.
- Run choice-based conjoint to measure the trade-offs and price consumers would accept.
- Interview consumers to hear whether they describe wanting the product unprompted and whether they would believe this brand offering it.
If a gap survives an ideal-point overlay and a concept test with the target segment, it is worth a business case; if it exists only on the grid, it is a question for the next study.
Repositioning a brand that overlaps competitors
A brand sitting inside a crowded cluster has three ways out:
- Shift an attribute: Change something the product delivers, such as formulation, design or price, so the rating moves for a concrete reason.
- Change the messaging: Emphasize a strength the brand already has that consumers do not yet see.
- Pick a new axis: Compete on a dimension rivals do not own, after research confirms consumers weigh it when they buy.
Dawar and Bagga argued in Harvard Business Review in 2015 that repeated charting as marketing initiatives roll out can track changes in consumer perceptions.
Limitations of perceptual maps
Every map trades detail for clarity, and most of those trades have a known response:
- Two dimensions oversimplify: Most categories are bought on more than two attributes, so teams plot several pairs and report how much variation the plotted dimensions explain.
- Attribute selection bias: A map only shows differences on the attributes the researcher chose, so a brand’s unique traits can vanish unless the attribute list starts from consumer language.
- Information lost in compression: Reducing many ratings to two dimensions approximates the data, so teams check conclusions against the underlying numbers.
- Snapshot in time: Positions shift after launches and campaigns, so maps need repeating.
- No link to performance: Standard maps do not connect position to sales or price, and sizing bubbles by sales or price is a partial fix.
- Misleading survey answers: Consumers may rate brands they have never bought.
Tools and templates for building perceptual maps
Simple maps need only a spreadsheet; reduction methods need statistical software:
- Excel: AVERAGE per brand, a scatter or bubble chart, and the “Values From Cells” data-label option to show brand names, with no native MDS or correspondence analysis.
- XLSTAT: An Excel add-in with MDS, correspondence analysis, multiple correspondence analysis, preference mapping and free-sorting analysis.
- SPSS: PROXSCAL for MDS, Proximity Mapping (PROXMAP) in version 32, and CORRESPONDENCE in the Categories module.
- R: smacof and base cmdscale for MDS, FactoMineR’s CA() and PCA(), and factoextra’s fviz_ca() for plots.
- Python: scikit-learn’s MDS and PCA classes, plotted with matplotlib’s scatter and annotate.
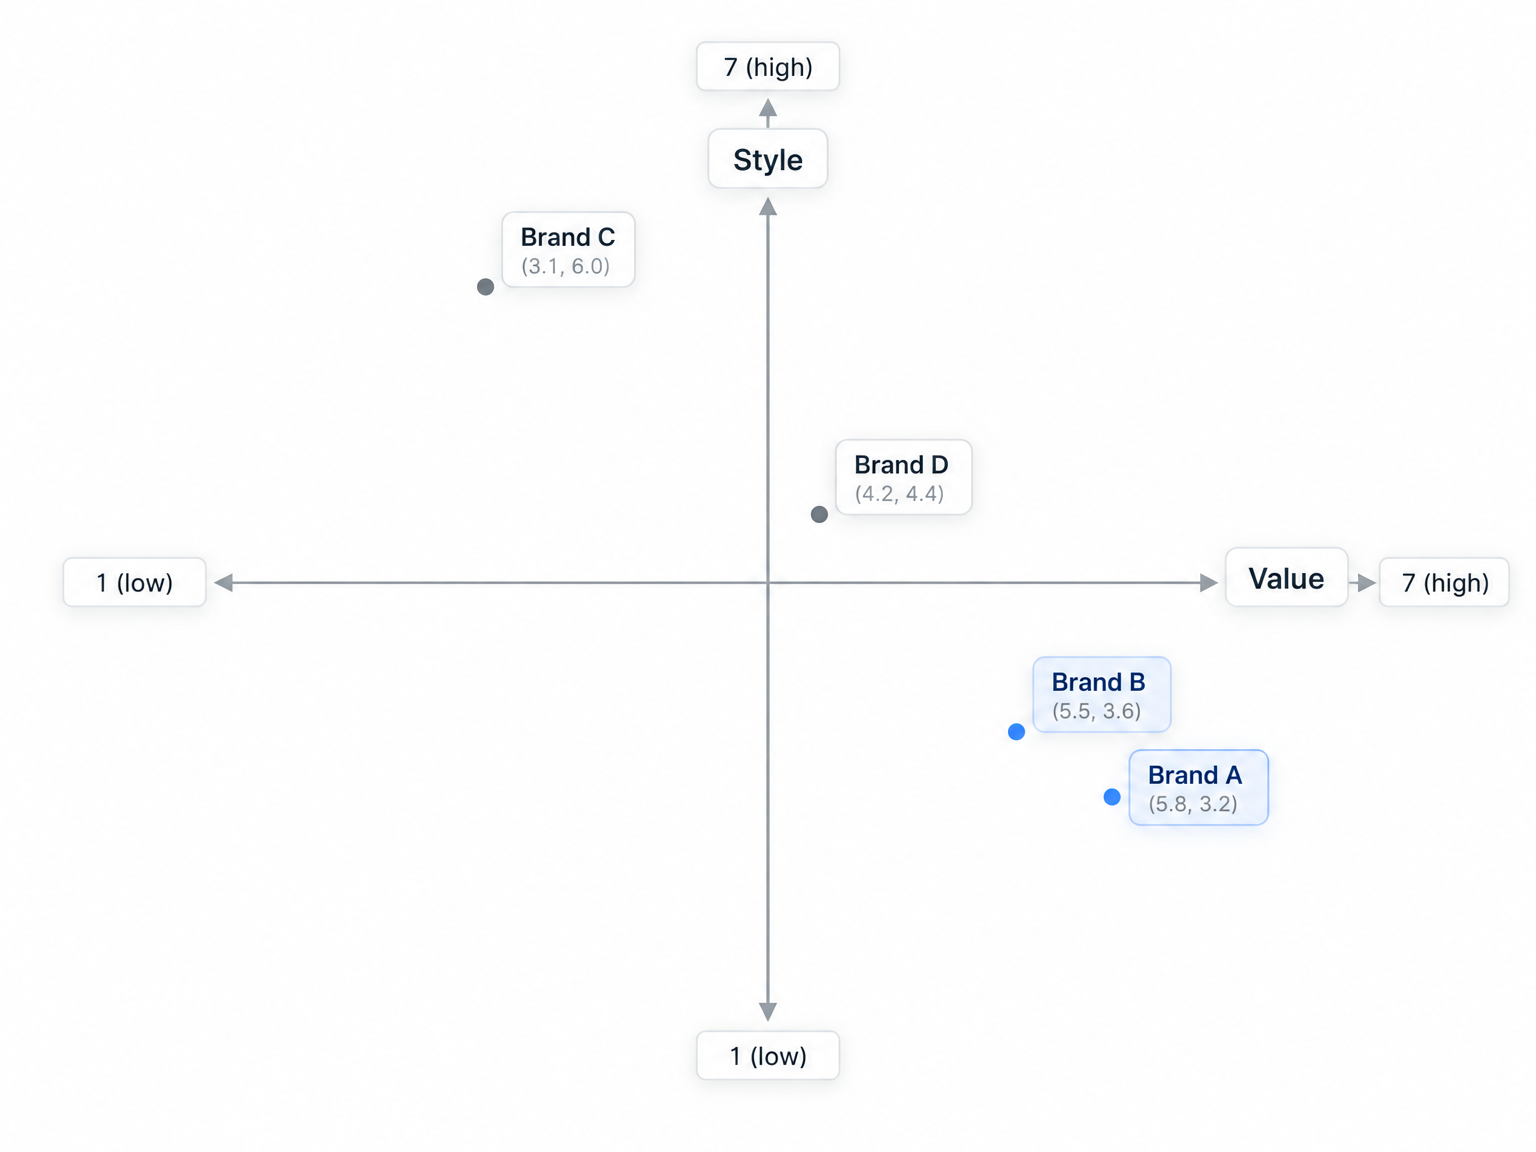
A hypothetical survey shows the path from ratings to plot. Suppose 300 consumers rate four brands on value and style, each on a 1 to 7 scale, and the averages come out as follows:
With axes crossing at 4, Brands A and B cluster as value plays with weak style, Brand C owns style, and Brand D sits near the center, distinct on neither attribute.
How qualitative research explains positions on a perceptual map
A finished map shows where each brand sits, but not why a consumer rated Brand D a 4 on style or what would move it. Qualitative research supplies the because: the experiences, comparisons and words behind each rating, which tell a team which lever to pull.
Strella runs voice-to-voice AI-moderated interviews with real consumers, which adds three things to a mapping study:
- The AI moderator follows the team’s discussion guide, which can include rating and ranking questions, and asks follow-up questions based on what each participant says, so a consumer rates a brand and explains the score in one conversation.
- Card sorting runs with live AI probing, which turns a sort into an explanation of why brands belong together.
- Hundreds of interviews run in parallel, and every finding links to the participant’s own words and video.
To hear how the moderator follows up on answers, try an interview. Teams can also run human-moderated interviews on Strella for studies where cultural nuance or emotional weight is high. The interviews explain positions; the quantitative ratings still place brands on the grid.
Prose tested a new brand and creative direction on Strella. Insights teams without bandwidth can get hands-on research support from Strella’s research team as full service.
See Strella in action
FAQ
What is an example of a perceptual map?
A common example plots car brands on price against a luxury-to-sportiness axis. Ferrari and the Ford Mustang sit at the sporty end, the Lincoln Town Car at the luxury-sedan end, and the Volkswagen Golf and Hyundai Sonata at the low-cost, middle-of-the-road position.
How many brands should a perceptual map include?
No fixed number exists, but similarity-based MDS needs at least seven or eight brands for a two- or three-dimensional map. The practical limit is legibility when labels begin to overlap.
How often should a perceptual map be updated?
Many large companies have traditionally run brand tracking once or twice a year, and maps can follow the same cadence. Teams may also update maps after a launch, repositioning, or new competitor entry.
Can a perceptual map use more than two dimensions?
Yes. MDS can produce three-dimensional solutions. Beyond three dimensions, interpretation becomes very difficult and the extra fit is rarely worth it.
Which software do teams use to make perceptual maps?
Excel handles simple two-attribute maps from averaged ratings. For MDS, PCA or correspondence analysis, teams use XLSTAT, SPSS, R packages such as smacof and FactoMineR, or Python’s scikit-learn with matplotlib.