
.svg)
.svg)

Add Comparison: Segment and Filter Your Insights
The Add Comparison feature lets you view differences across participant groups — by screener questions or in-call survey responses — directly within your analysis view. It’s a fast way to segment your qualitative data without exporting or creating new projects.
How to use it
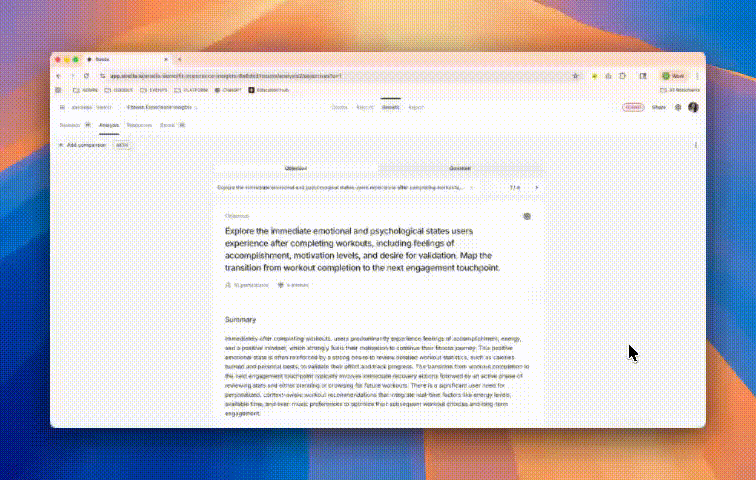
- Go to your Analysis view.
- Click Add Comparison in the top right corner.
- Choose the variable you want to compare by:
- Screener question (e.g., “Have you used this product before?”)
- In-call survey question (e.g., “How would you rate your experience?”)
- Select the response options or groups to include (e.g., Yes vs No, Low vs High).
- Strella automatically filters your insights, themes, and quotes by those groups.
- Toggle comparisons on/off or switch variables to explore different segments.
What you’ll see
- Charts and themes update automatically for each comparison group.
- Verbatims are labeled by segment (e.g., “Screener: Experienced Users”).
- Frequency counts and sentiment summaries appear side by side.
Use cases
- Identify how different audiences respond to the same concept.
- Spot differences in sentiment, needs, or behavior across key groups.
- Build sharper recommendations (e.g., “New users emphasize ease of use; experienced users focus on customization”).


